SMART HDD monitoring with Scrutiny for Synology
Synology has a build in monitoring tool for HDD health. However, it is not possible anymore to have a detailed look into the different parameters. That was until I stumbled on Scrutiny. It is a small but efficient monitoring tool that can run inside a docker container (perfect for my setup). The basic docker compose file looks like this:
services:
  scrutiny:
    container_name: scrutiny
    image: ghcr.io/analogj/scrutiny:master-omnibus
    cap_add:
      - SYS_RAWIO
      - SYS_ADMIN
    ports:
      - "8080:8080" #web
      - "8086:8086" #influxdb
    volumes:
      - /run/udev:/run/udev:ro
      - config:/opt/scrutiny/config
      - influxdb:/opt/scrutiny/influxdb

volumes:
  config:
      driver: local
      driver_opts:
        type: "nfs"
        o: "nfsvers=4,addr=10.1.1.20,rw"
        device: ":/volume1/docker/scrutiny/config"
  influxdb:
      driver: local
      driver_opts:
        type: "nfs"
        o: "nfsvers=4,addr=10.1.1.20,rw"
        device: ":/volume1/docker/scrutiny/influxdb"
basic docker-compose.yaml
The different HDDs are normally not available or accessible inside docker containers. Therefore they have to be manually mapped into the container. To do that we first need to identify the HDDs in the host system.
Usually those are SATA or NVME drives. The easiest way identify them is to SSH into the NAS and execute fdisk -l This will create a list of all available drives. You can see the output below.
$ fdisk -l
fdisk: cannot open /dev/md0: Permission denied
fdisk: cannot open /dev/loop0: Permission denied
fdisk: cannot open /dev/zram0: Permission denied
fdisk: cannot open /dev/zram1: Permission denied
fdisk: cannot open /dev/zram2: Permission denied
fdisk: cannot open /dev/zram3: Permission denied
fdisk: cannot open /dev/md1: Permission denied
fdisk: cannot open /dev/synoboot: Permission denied
fdisk: cannot open /dev/md2: Permission denied
fdisk: cannot open /dev/sata2: Permission denied
fdisk: cannot open /dev/sata5: Permission denied
fdisk: cannot open /dev/sata1: Permission denied
fdisk: cannot open /dev/sata3: Permission denied
fdisk: cannot open /dev/sata4: Permission denied
fdisk -l
For our monitoring only the sataX drives are important. I am using a Sinology RS1221+ and it seems that the identifier are a little bit different compared to other systems. As you can see my drives are following the format sataX where X is a incremental number.
It seems that Scrutiny is not working so well with this identification (at least not the docker version I am using here). That is why we are mapping those devices t0 the more commonly known format of sda, sdb, ... Therefore we are adding the following snippet:
devices:
  - "/dev/sata1:/dev/sda"
  - "/dev/sata2:/dev/sdb"
  - "/dev/sata3:/dev/sdc"
  - "/dev/sata4:/dev/sdd"
  - "/dev/sata5:/dev/sde"
Now the full docker-compose.yaml looks like this:
services:
  scrutiny:
    container_name: scrutiny
    image: ghcr.io/analogj/scrutiny:master-omnibus
    cap_add:
      - SYS_RAWIO
      - SYS_ADMIN
    ports:
      - "8080:8080" #web
      - "8086:8086" #influxdb
    devices:
      - "/dev/sata1:/dev/sda"
      - "/dev/sata2:/dev/sdb"
      - "/dev/sata3:/dev/sdc"
      - "/dev/sata4:/dev/sdd"
      - "/dev/sata5:/dev/sde"
    volumes:
      - /run/udev:/run/udev:ro
      - config:/opt/scrutiny/config
      - influxdb:/opt/scrutiny/influxdb

volumes:
  config:
      driver: local
      driver_opts:
        type: "nfs"
        o: "nfsvers=4,addr=10.1.1.20,rw"
        device: ":/volume1/docker/scrutiny/config"
  influxdb:
      driver: local
      driver_opts:
        type: "nfs"
        o: "nfsvers=4,addr=10.1.1.20,rw"
        device: ":/volume1/docker/scrutiny/influxdb"
docker-compose.yaml
We mapped two folders in the container. Inside the config folder we are creating another yaml file. It is called collector.yaml and it contains all the drives Scrutiny will monitor. We are adding all the drives that were previously added to the docker-compose.yaml file, but with newly mapped notion.
devices:
  - device: /dev/sda
    type: 'sat'
  - device: /dev/sdb
    type: 'sat'
  - device: /dev/sdc
    type: 'sat'
  - device: /dev/sdd
    type: 'sat'
  - device: /dev/sde
    type: 'sat'
collector.yaml
docker-compose.yaml to map them into the container and in the collector.yaml to tell Scrutiny to monitor them.Now we can start the container and Scrutiny should be available right away. You can use port 8080 to access the web interface.

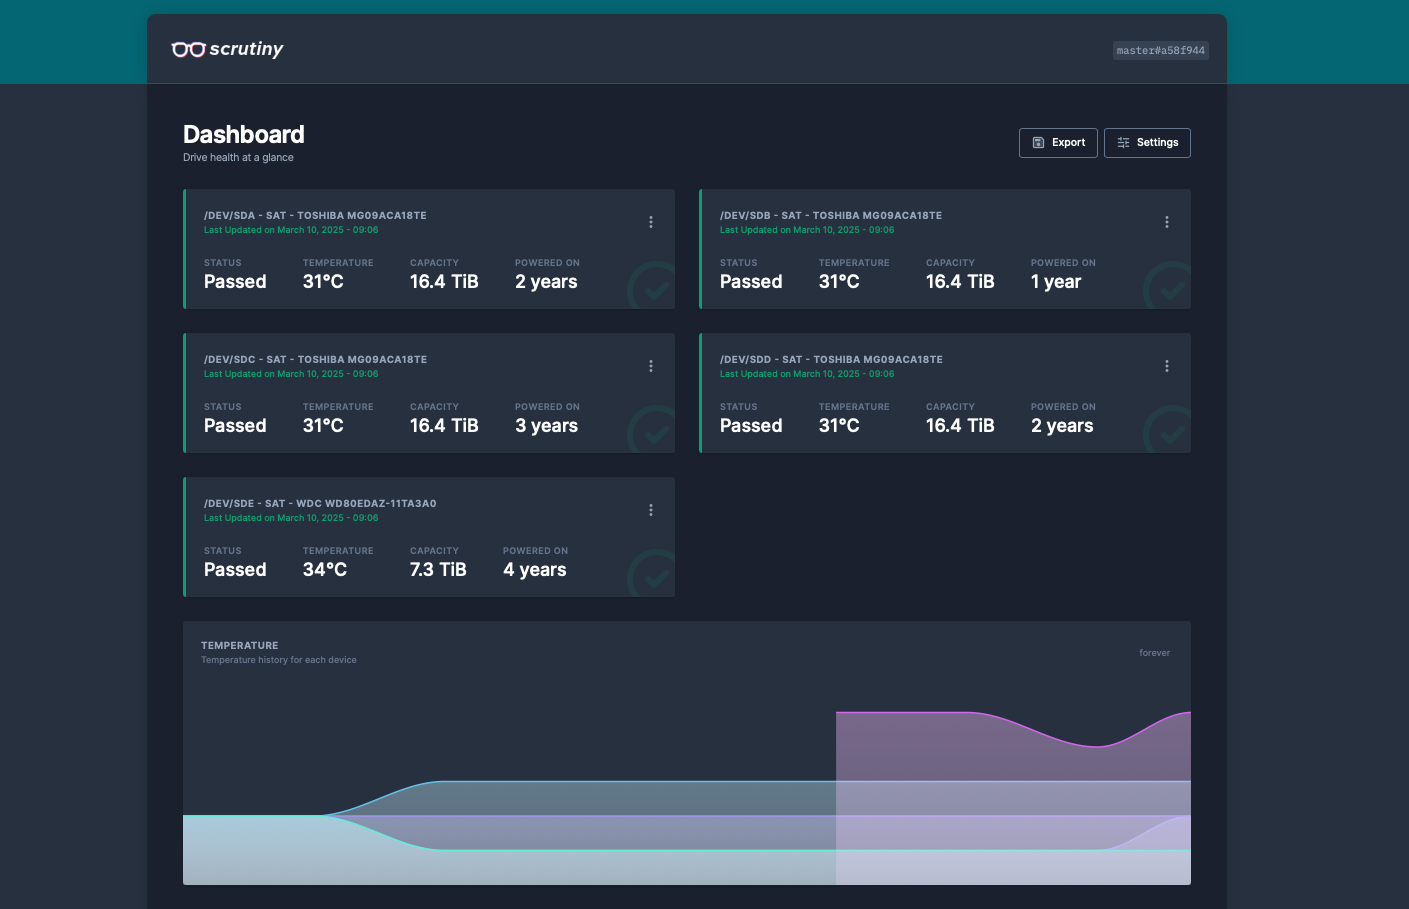
Now we have an overview of the status of all our drives and can deep dive into the SMART parameters if needed.
